
Alpha
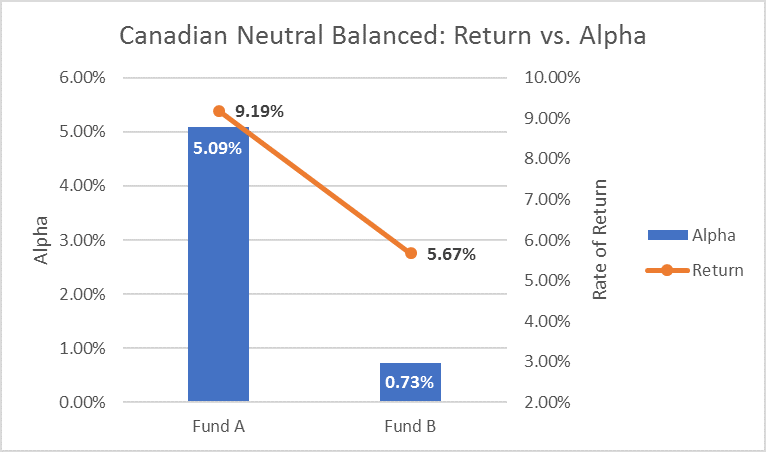
Simply put, Alpha represents the value that a portfolio manager adds or subtracts from a fund portfolio's return. For example, if a fund's alpha is +1%, the fund has outperformed the benchmark by 1%. Similarly, if the alpha is -1%, the fund has underperformed the benchmark by 1%. Overall, a higher, positive alpha is what you should see for your mutual fund.
Below is an example of two popular mutual funds from the exact same category. The Alpha and Rates of Return are based on 5 year averages, and the data has been collected from Google Finance and Globe Advisor.
We can see that not only does "Fund A" have far better rates of return (9.19% per year over the past 5 years vs. 5.67% per year) than "Fund B", but the higher Alpha also tells us that this difference in return is due to the fund manager's skill.
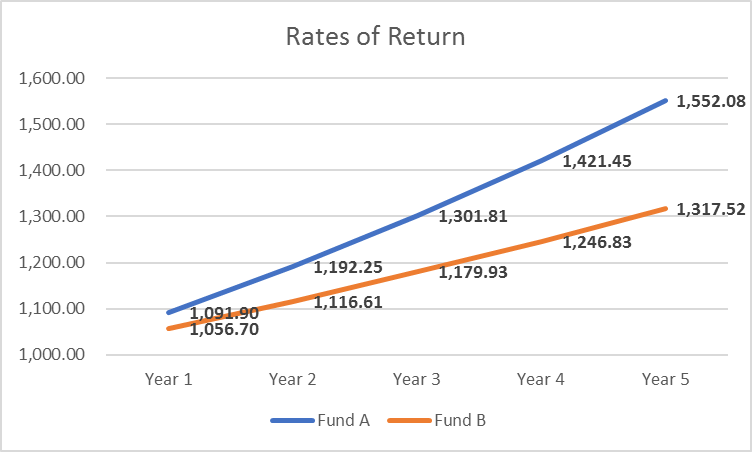
Rates of Return are important to consider. If you had started with $1,000 in each of these mutual funds, over 5 years you would have:

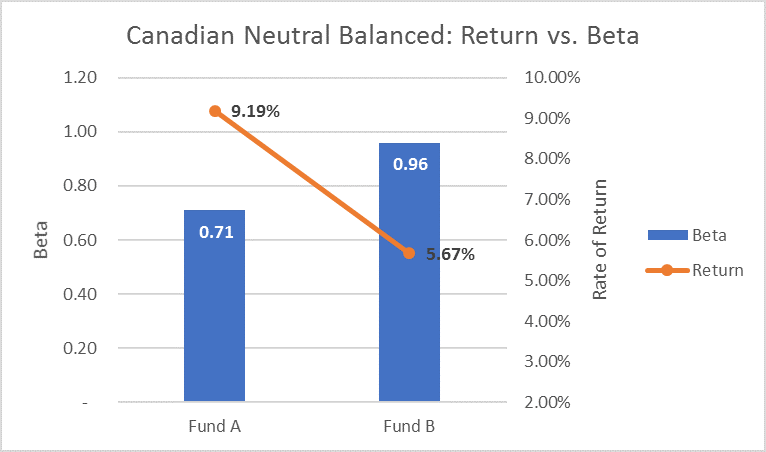
Beta
This one can be a little trickier to define. Beta is a measure of risk, and how it compares to the risk of a market. Market Beta is 1.0 - if your mutual fund has a beta lower than 1.0, it will be less volatile than the market. If the beta is more than 1.0, it will be more volatile than the market.
Again, we look at those two popular mutual funds from the Canadian Neutral Balanced Category and compare their rates of return to their betas. These figures are based on 5 year averages and the data has been collected from Google Finance and Globe Advisor.

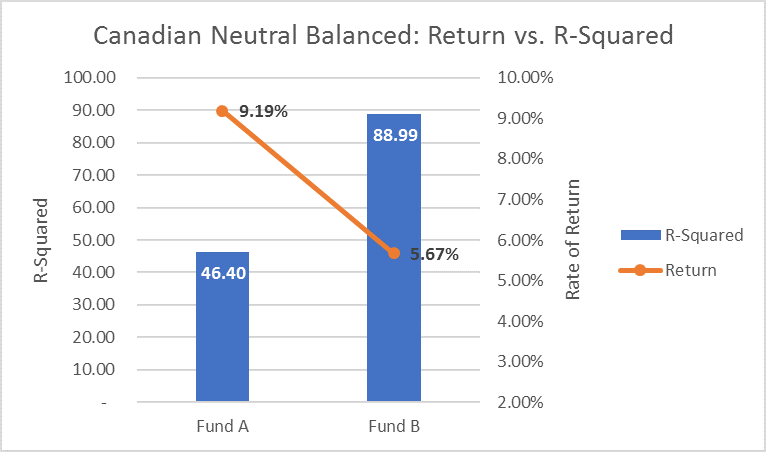
R-Squared
R-Squared is a number from 0 - 100 that explains the correlation between a mutual fund and the index. A high R-Squared means the fund closely follows the movements of the index.
We often call mutual funds with very high R-Squared values "closet indexers". The manager of the fund is generally following an index very closely, and potentially not 'earning his keep'. Why would you pay a manager a fee when you could follow the index and do it yourself?
This is why R-Squared is an important figure to know, and in turn, will generally coincide with Alpha, which is the portion of the return that can be attributed to a manager's skill.

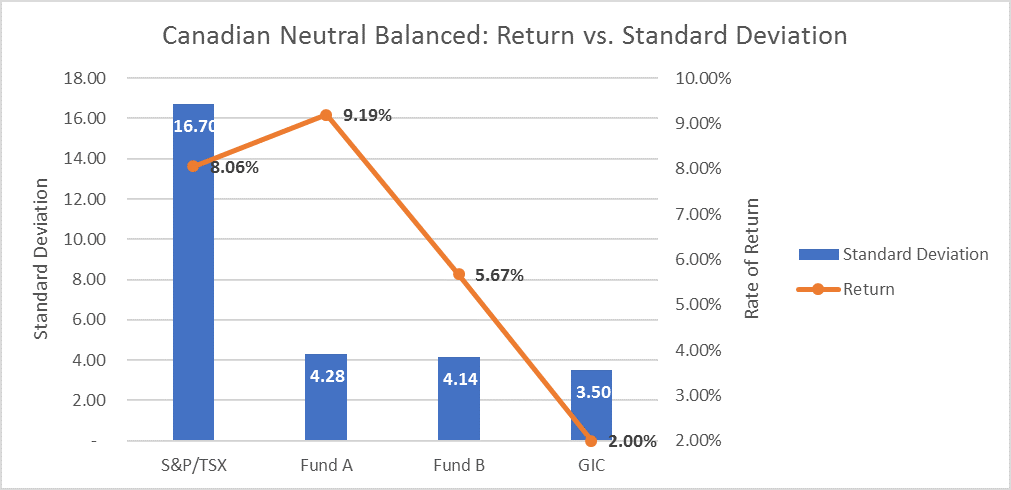
Standard Deviation
This one is pretty simple to define - it is the risk of a mutual fund. Standard Deviation represents the variability or range of price movements, which then people often view as risk... For example, if a fund drops a lot or goes up in value quickly, it can be thought as 'riskier'
A higher standard deviation, meaning higher deviations from the mean, is a higher risk fund. We often say risk can be tricky to understand, so we like to unitize it. A GIC at the bank, according to the 2016 Andex Chart from Morningstar, is a 3.5. The S&P/TSX is a 16.7. From there, it is easier to compare the risk of your mutual fund between something very low risk (a GIC) to something that can have more ups and downs (the Stock Market).

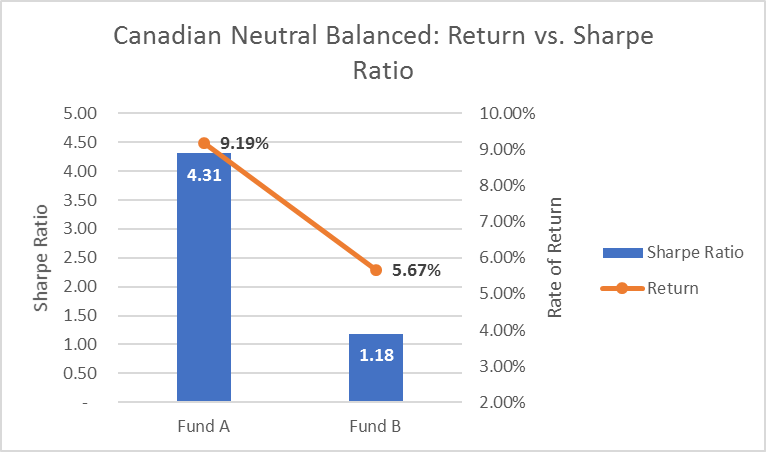
Sharpe Ratio
Basically, a sharpe ratio is how much return you are getting for how much risk you are taking. The greater a sharpe ratio is, the better its risk-adjusted performance is.

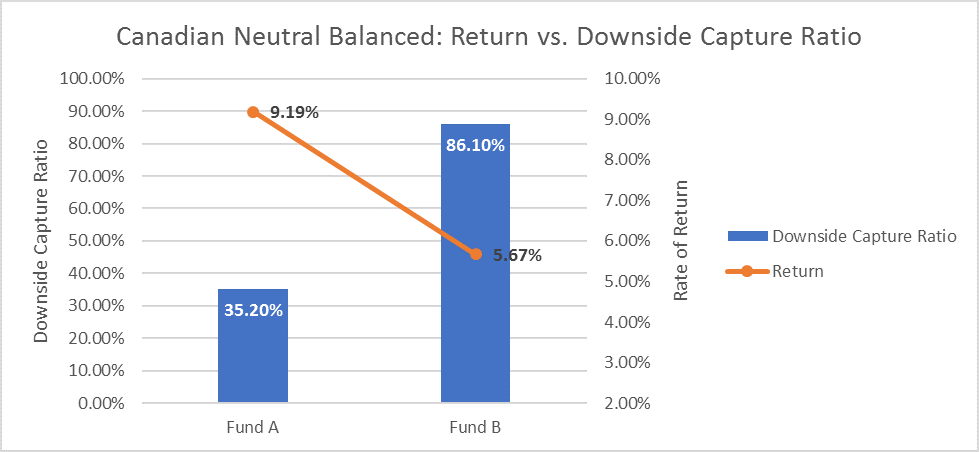
Downside Capture
This is a very important measure. Downside Capture measures how much your mutual fund will go down when the market goes down... For example: if your mutual fund has a 100% downside capture, when the market drops 10%, the mutual fund will also drop 10%.
In your mutual fund, it would be best to have a very low downside capture ratio - the lower the ratio is, the less your fund will drop when the market takes a dip. This means that when the market begins to recover, you have less to recover from.